The Gold/Silver Ratio is more than just an interesting statistic for precious metals enthusiasts. It has guided empires, shaped monetary policies, and offered modern-day investors a roadmap for buying and selling their favorite metals. If you have ever wondered when to buy silver instead of gold—or how to swap one metal for the other at just the right time—this guide is for you. Below, we break down every aspect of the ratio, from its historical origins to modern trading techniques and predictions for the future.
SECTION 1: What Is the Gold/Silver Ratio?
1.1 Defining the Ratio
At its core, the Gold/Silver Ratio shows how many ounces of silver it takes to buy one ounce of gold. This simple calculation has existed for centuries, reflecting the fluctuating relationship between two of the oldest forms of money known to humanity. Because gold and silver have unique roles in the economy—gold as the ultimate safe haven and silver as both a precious metal and an industrial resource—the ratio between them can shift quickly.
1.2 Ancient Roots and Historical Context
The importance of the Gold/Silver Ratio dates back to ancient civilizations like Rome, where legal mandates sometimes fixed the ratio at approximately 12:1. Silver was considered common currency, while gold served larger transactions and wealth storage for the elite. In the United States, the Founding Fathers also acknowledged a tight ratio (about 15:1) when establishing the monetary system under the Constitution. These historical precedents highlight how society once viewed silver as nearly on par with gold—a stark contrast to modern times, where the ratio often sits at much higher levels.
- 10:1 to 15:1: Ancient Rome and early U.S. laws (Silver was core to daily commerce)
- 40:1 to 50:1: 20th-century average (More balanced with changes in currency systems)
- 70:1 to 90:1: Crisis levels (Silver becomes cheap relative to gold during economic stress)
1.3 The Modern Era: Swinging from Crisis to Crisis
In more contemporary settings, the ratio has seen wild swings. Economic recessions, wars, changes in mining technology, and shifts in investor sentiment can all drive the ratio significantly in one direction or another. Notable periods like the 1980 precious metals spike and the 2008 financial crisis saw dramatic jumps in the ratio, underscoring its value as a barometer for market psychology.
1.4 Why the Ratio Matters Today
For precious metals stackers (those who accumulate physical bullion), the Gold/Silver Ratio provides a logical basis for deciding which metal to buy at any given time. When the ratio is high—say, 75:1 or above—it often signals that silver is relatively undervalued. Conversely, when the ratio dips significantly below 50:1, gold may be the better bargain. This interplay allows investors to rotate between metals to maximize the total number of ounces they can hold without constantly spending new money.
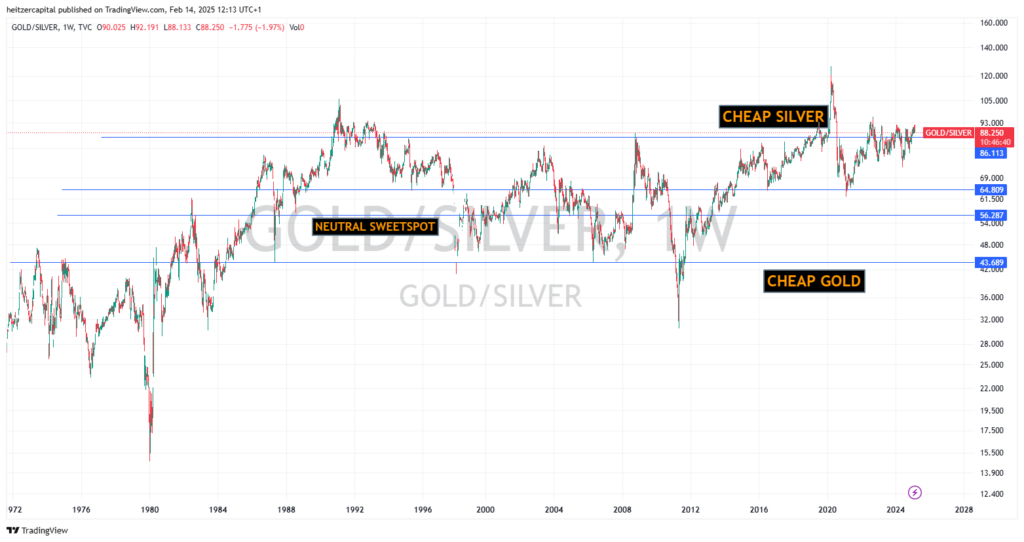
1.5 Charting the Ratio: A Visual Guide
Visual learners often benefit from looking at a long-term chart of the Gold/Silver Ratio. Imagine a line graph that pinpoints key historic events:
- The Great Depression
- The spike in 1980, when silver and gold both soared
- The 2008 financial meltdown
- The 2020 pandemic surge, where the ratio hit around 120:1
By observing these peaks and troughs, you can see how silver’s price sometimes lags behind gold in moments of crisis, only to catch up or even overshoot once fear subsides. This cyclical nature is what makes following the ratio so compelling.
1.6 Tracking the Ratio in Real-Time
While history teaches valuable lessons, modern technology allows us to track the ratio 24/7. Real-time Gold/Silver Ratio trackers abound online, offering quick updates as markets shift around the globe. (CTA) Check out our free live Gold/Silver Ratio tracker if you want to see current fluctuations at any hour of the day. A quick glance can confirm whether silver is “on sale” relative to gold—or if gold is edging into the more attractive zone.
SECTION 2: How to Use the Gold/Silver Ratio to Time Your Buys
2.1 Why Timing Matters
Timing can be the difference between a profitable precious metals portfolio and one that simply treads water. Because gold and silver each respond differently to economic news, geopolitical events, and market sentiment, the Gold/Silver Ratio offers a reliable compass. A swing in the ratio can happen quickly, so those who watch it closely have an edge in knowing which metal might offer better value.
2.2 The Simple Rule for Stackers
While some investors swear by complicated algorithms, stackers often use a straightforward rule of thumb:
- Buy silver when the ratio is high (above 75:1). This implies that silver is inexpensive relative to gold, allowing you to acquire more ounces for the same cost.
- Trade for gold when the ratio is low (below 50:1). At these levels, gold is considered cheap compared to silver, suggesting it might be time to move silver holdings into gold.
2.3 Historical Examples of Smart Trades
- 2008 Crash: During the global financial crisis, the ratio hit 85:1, signaling that silver was exceptionally cheap. Investors who bought silver at this level saw substantial gains when the economy rebounded.
- 2011 Silver Run: As the ratio dropped to around 30:1—one of the lowest points in modern times—silver had become overbought. Those who swapped silver for gold at this point locked in significant profits.
- 2020 Pandemic: Economic panic drove the ratio to an unprecedented 120:1. Savvy stackers took advantage of bargain prices in silver, accumulating large quantities before silver prices started recovering.
2.4 Emphasizing Patience and Discipline
A key advantage of the ratio-based strategy is that it removes much of the guesswork. Instead of trying to anticipate short-term price fluctuations for both metals, you focus on a single metric. However, it also demands patience. The ratio does not swing dramatically every week, so you might wait months (or even years) for optimal conditions.
2.5 Practical Steps for the Average Investor
- Monitor a reliable ratio tracker daily or weekly.
- Set personal thresholds. For instance, you might decide to buy silver only when the ratio exceeds 80:1 and flip to gold once it falls below 50:1.
- Keep a record of your trades. A simple spreadsheet can help you track the ratio levels at which you purchased silver or swapped into gold, confirming whether you are sticking to your plan.
2.6 Get the Full Playbook
While these guidelines give you a solid start, a deeper dive can refine your entries and exits. (CTA) Grab The Stacker’s Handbook to learn exactly when to trade and how to manage premiums, taxes, and storage costs. Having a detailed approach increases your confidence and avoids impulsive decisions based solely on market chatter.
SECTION 3: Trading Strategies for Stackers & Investors
3.1 Strategy Overview
Not all traders or stackers have the same risk appetite, time horizon, or market knowledge. Therefore, one size does not fit all. Below are three popular approaches to using the Gold/Silver Ratio, ranging from conservative to more aggressive techniques. Each offers its own balance of pros and cons.
3.2 Strategy One: The Classic Ratio Trade (Slow & Steady)
Ideal for the long-term investor, this approach involves waiting for the ratio to reach historically high levels—usually 80:1 or above—before accumulating silver. Then, you hold onto that silver until the ratio falls to around 50:1, at which point you flip some or all into gold.
- Pros:
- Safe and historically grounded
- Minimal stress once you set your thresholds
- Works over multi-year cycles
- Cons:
- Requires patience and long wait times
- Misses smaller fluctuations that could also be profitable
This method is well-suited for individuals who do not want to monitor daily charts or tweak their portfolio too frequently. You simply set your ratio targets and allow the market to do its thing.
3.3 Strategy Two: The Tactical Stack Shift (Active Traders)
For those more comfortable watching metals markets daily or weekly, a tactical approach can yield extra gains. In this scenario, you might begin selling silver at 60:1, move more aggressively at 50:1, and go all in when the ratio hits 40:1.
- Pros:
- Capitalizes on mid-cycle shifts
- Allows for multiple profit-taking events
- More flexibility if the ratio does not reach extreme highs or lows
- Cons:
- Requires continuous attention
- Small mistakes can eat into gains
Active traders often combine technical analysis of gold and silver charts with ratio-based decision-making, hoping to profit at multiple ratio thresholds.
3.4 Strategy Three: The Full Cycle Trade (Max Gains, Higher Risk)
At the most aggressive end of the spectrum, some investors aim to catch the extremes. They load up on silver when the ratio hits 85 or higher, ride it down as low as possible—maybe near 40—then swap into gold. Later, when the ratio climbs back up, they swap back to silver. This method can significantly multiply the number of total ounces you hold.
- Pros:
- Potential for substantial “ounce growth” through each full cycle
- High reward if executed correctly
- Cons:
- Requires pinpoint timing
- Trading costs and premiums need to be minimal
This advanced strategy suits experienced stackers with access to favorable premiums and the ability to execute swaps efficiently. (CTA) For those wanting real-life examples of how stackers have pulled off this complex maneuver, download our Gold/Silver Ratio Trading Guide for step-by-step case studies.
3.5 Tips for Success
- Watch premiums: High premiums can wipe out potential gains. Always factor in the cost of buying and selling before making a swap.
- Stay informed: Economic data, Federal Reserve policies, and global events can shift investor sentiment quickly.
- Use partial trades: If you are unsure whether the ratio has truly peaked or bottomed, consider incrementally swapping your metals to spread out the risk.
3.6 Mistakes to Avoid
- Acting on ratio changes that are insignificant or short-lived
- Ignoring storage and insurance costs
- Relying solely on historical precedents (the market can defy expectations in the short term)
SECTION 4: Best Tools for Tracking the Gold/Silver Ratio
4.1 The Importance of Real-Time Data
Whether you plan to hold precious metals for decades or trade them actively, having up-to-date ratio information is crucial. Markets can move fast, and a sudden shift in global sentiment might push the ratio from 70 to 85 in a matter of weeks. Relying on stale data puts you at a disadvantage, so keep your toolkit ready.
4.2 Recommended Free Trackers
- Kitco.com: Known for its reliable spot prices and charts, Kitco offers quick snapshots of the Gold/Silver Ratio throughout the trading day.
- GoldSilver.com: This platform provides historical data and insightful commentary on precious metals. It’s helpful for those who want context, not just numbers.
- Monex.com: With a user-friendly interface, Monex presents live data and trading insights that can be filtered by time frames or regions.
Each of these sites has strengths and weaknesses, but all are well-established resources in the precious metals community.
4.3 Our Exclusive Ratio Tracker (Coming Soon?)
We are developing a specialized ratio tracker that goes beyond simple data feeds. The goal is to offer:
- Live updates: No waiting for delayed quotes
- Custom Alerts: Set your desired ratio threshold and receive immediate notifications
- Historical Overlays: Compare today’s ratio with past market cycles for context
This tool aims to simplify your decisions by delivering curated insights along with the raw data. Stay tuned for future announcements.
4.4 Charting and Analysis: Going Deeper
If you want to analyze trends and spot potential inflection points, consider using charting software like TradingView. By plotting gold and silver prices (often in the form of XAU/USD divided by XAG/USD), you can layer technical indicators—like moving averages or Relative Strength Index (RSI)—to anticipate which direction the ratio may head next.
4.5 Spreadsheets: A Low-Tech But Effective Option
Some stackers prefer to track the ratio in a simple spreadsheet. This allows them to:
- Record daily, weekly, or monthly ratio data.
- Add personal notes about market conditions, news events, or economic announcements that might have influenced the ratio.
- Keep a detailed log of each trade, including date, ratio level, and the amount of metal swapped.
Over time, this personalized record can reveal patterns in your trading behavior and help you refine your approach.
4.6 Subscribing to Alerts and Updates
(CTA) Want an even easier option? Sign up for our weekly Gold/Silver Ratio update. We’ll send you an alert whenever the ratio approaches historically significant levels, ensuring you never miss an opportunity to buy or trade.
SECTION 5: Gold/Silver Ratio Predictions for 2024 & Beyond
5.1 Where We Stand Now
As of 2024, the ratio hovers around X:1 (please check current data for an exact figure). Historically, when the ratio sits in this band, it signals a particular phase in the silver-gold relationship. Has silver been lagging behind due to weak industrial demand, or is gold surging due to economic fears? Understanding the context helps predict what might happen next.
5.2 Potential Macro Scenarios
- Interest Rates Rising
- Higher interest rates can strengthen the dollar and weigh on gold prices.
- Silver might still find support if industries like electronics, renewable energy, and automotive manufacturing remain strong.
- The ratio could climb, reflecting gold under pressure and silver holding or gaining ground due to industrial demand.
- Inflation Surging
- Both metals generally rise during high inflation, but silver can outperform thanks to its dual role as a safe haven and a raw material.
- The ratio may compress (move lower) as silver sees higher percentage gains.
- Recession Hits
- In a recession, both metals might dip initially as investors liquidate assets, but gold often recovers faster due to its safe-haven appeal.
- Silver could lag because of reduced industrial output, potentially sending the ratio higher in the short term.
5.3 Historical Context: Repeating Patterns
Looking back, certain patterns recur. In times of acute crisis, gold gets the spotlight, which can push the ratio upward. As conditions improve, silver often plays catch-up, driving the ratio back down. Spotting these cycles helps stackers decide when to accumulate silver and when to pivot to gold.
5.4 Expert Insights
Market analysts differ in their outlooks, but many watch the ratio closely to confirm or challenge their forecasts. Some foresee a continued upward trajectory if interest rates remain high, while others expect a dramatic silver rally if global efforts to boost green technology accelerate. The truth is likely somewhere in between, so staying informed about both macroeconomics and industrial trends is crucial.
5.5 Pro Tips for Navigating 2024
- If the ratio is above 80: Focus on stacking silver. Historically, those who buy silver at these levels see significant returns when the ratio falls back toward historical averages.
- If the ratio dips below 50: Consider swapping some silver for gold. This move consolidates your gains in silver and positions you for future cycles.
- Stay Flexible: The ratio can whipsaw, especially in volatile markets. It’s wise to keep some liquidity on hand to pounce on sudden opportunities.
5.6 Subscribe for Real-Time Updates
(CTA) If you want timely insights throughout the year, subscribe to our weekly Gold/Silver Ratio updates. We analyze shifts in the ratio along with major economic indicators, helping you stay a step ahead of big market moves.
CONCLUSION: The Ratio Is Your Secret Weapon for Stacking More Ounces
The Gold/Silver Ratio has guided empires, influenced monetary systems, and continues to help modern investors optimize their portfolios. By paying attention to this single metric, you can often pinpoint whether gold or silver is the better buy at any given moment—and adjust your holdings accordingly.
Key Takeaways
- Buy Silver When the Ratio Is High (above 75:1, and especially if it creeps toward 80:1 or 90:1).
- Swap into Gold When the Ratio Is Low (below 50:1 is a strong indication, with 40:1 or 30:1 showing a potential silver peak).
- Stay Informed: Markets are unpredictable, but consistent ratio tracking keeps you agile.
- Use Historical Context: Time-tested cycles can give you clues about future moves.
- Leverage Modern Tools: From free online trackers to advanced charting, choose the resources that fit your style and schedule.
Above all, remember that precious metals investing is often a marathon, not a sprint. The ratio offers significant rewards for those who can wait for the right opportunities. If you are serious about stacking efficiently and maximizing your ounces, keep the ratio front and center in your strategy.
Ready to take full advantage of the Gold/Silver Ratio? Download The Stacker’s Handbook for a detailed, step-by-step approach to stacking metals, setting ratio targets, and making well-timed trades. Equip yourself with the knowledge and tools to thrive in any economic climate—and watch your stack grow stronger with each cycle.
Want to master gold & silver investing? Get your copy of The Stacker’s Handbook – Your complete guide to building wealth with precious metals!
Watch my YouTube Channel for expert insights on stacking gold & silver!
Stack in style! Check out Stacker’s Gear for premium gold & silver investing apparel and accessories.
